
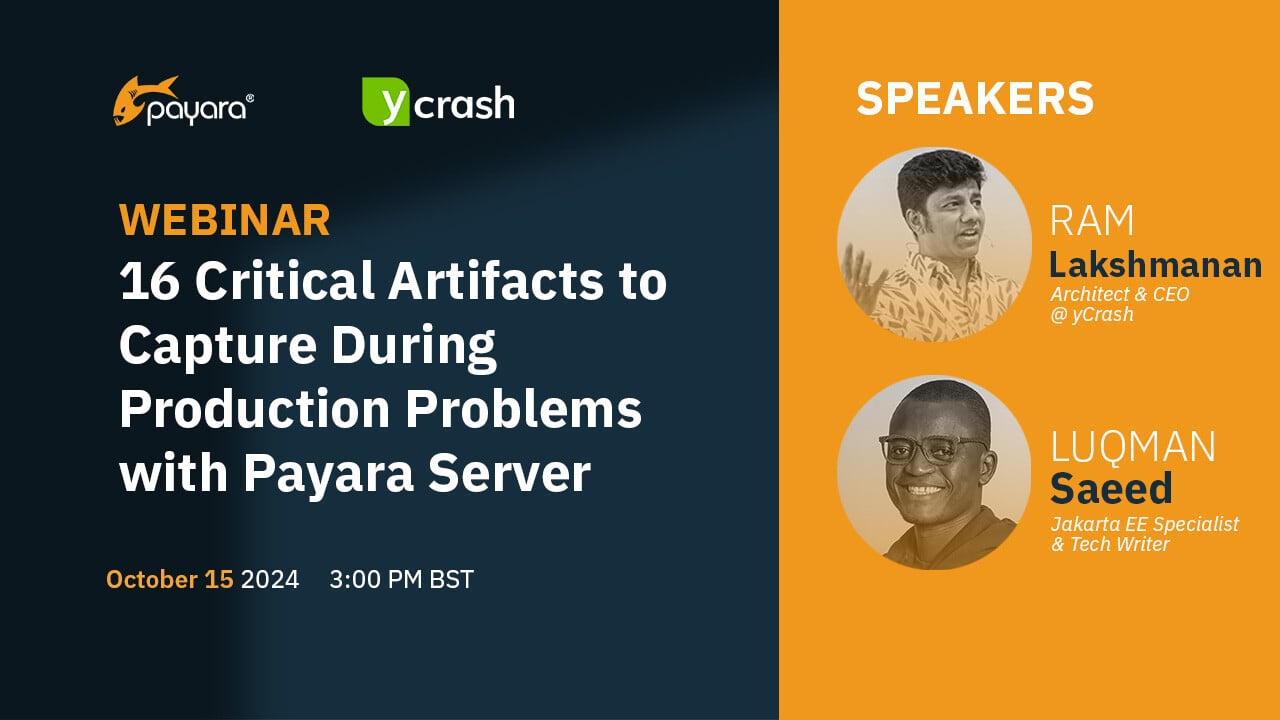
Join Live Webinar Series – Boost Your System Performance: Troubleshoot Faster & Cut GC Waste
We’re excited to invite you to two informative webinars happening later this month, which we’re running in collaboration with […]
Robust and efficient application servers are crucial for companies relying on software applications, whether supporting e-commerce platforms, financial services […]
Robust and efficient application servers are essential for companies relying on software applications, whether these support e-commerce platforms, financial […]
Within Payara Server, the JMX system is used to store all the data that the monitoring service captures of […]
What happens when an application designed for a small user base needs to be scaled up and moved to […]
嬉しいお知らせです。Payara Platform 5.194から、Payara Serverにはサーバーの状態を可視化できる組み込みの監視コンソールが搭載されます。
We are happy to announce that from the Payara Platform 5.194 release onwards Payara Server ships with a built-in […]
This is an updated blog of the original which was published in May 2016 Payara Server provides the Health […]
Payara Server provides many metrics within JMX beans. The most interesting metrics are the statistics around pools for HTTP […]
(This is an update of this blog written in 2016: Making Use of Payara Server’s Monitoring Service) Payara […]
JConsole is a useful tool for monitoring Java processes. You can collect data from a Java process such as: […]
Did You Know?