The Health Check Service In-Depth – Payara Server 5
Payara
This is an updated blog of the original which was published in May 2016
Payara Server provides the Health Check Service for automatic self-monitoring in order to detect future problems as soon as possible. When enabled, the Health Check Service periodically checks some low level metrics. Whenever it detects that a threshold is not met, it triggers alert notifications that allow to detect undesired behavior and predict possible failures. All of these automatic checks are very lightweight and run with a negligible impact on performance.
The Health Check Service periodically checks several metrics, such as CPU and memory usage. If any of these metrics exceed a configured threshold, then a notification message is sent through the Notification service to an appropriate notifier. The default Log notifier prints the message to Payara Server’s log file with an appropriate log level. Other notifiers can process notifications further or forward them to external systems. When properly configured, this mechanism helps to rapidly detect problems or work out what happened after problems had occurred. It also provides enough flexibility to route the information about detected anomalies to external systems to store the information, process it and even attempt to heal some problems automatically.
For most of the checks, threshold configurations can be specified in 3 different levels: good, warning and critical. When the threshold is not met, the Health Check Service will trigger a notification with the level of Warning, Error or Critical respectively and will continue to do so periodically until the threshold is met.
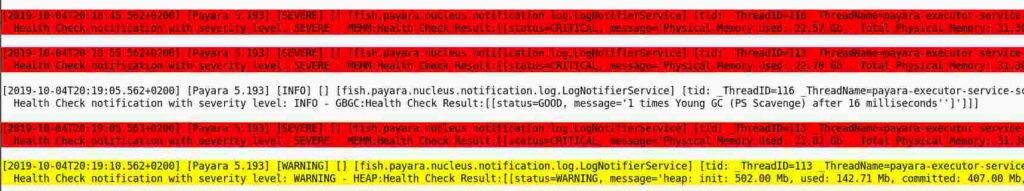
This is how the notifications routed to the server’s log file might look like in a log viewer:
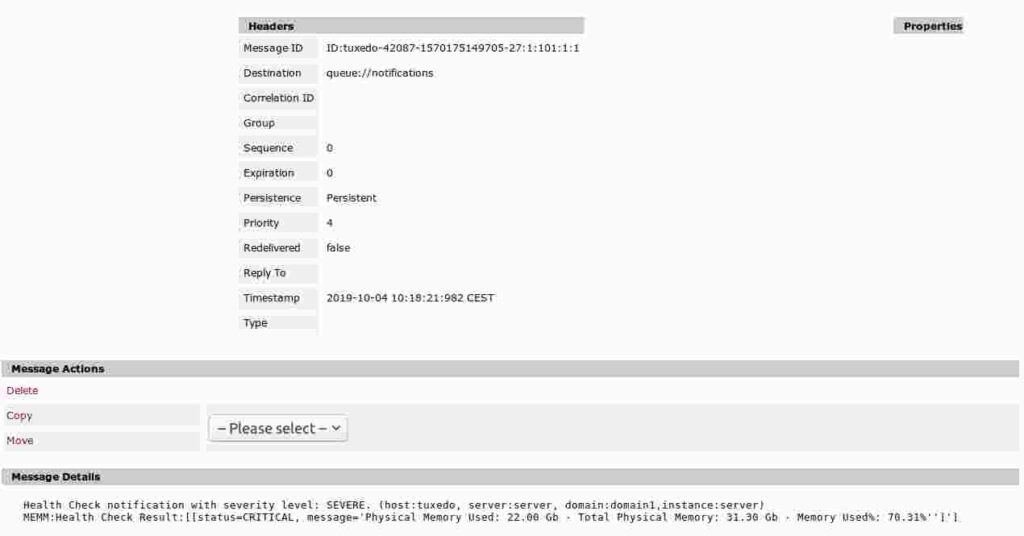
Or, if we enable a JMS notifier, the Health Check notifications will also end up in a JMS queue. Here is how a message would look like in an ActiveMQ broker’s queue:
The Health Check service functionality is available in the core Payara Platform and therefore also in Payara Micro. It can be configured in both Payara Server and Payara Micro using the same asadmin commands. Payara Server also provides Admin Console to configure everything using a web UI.
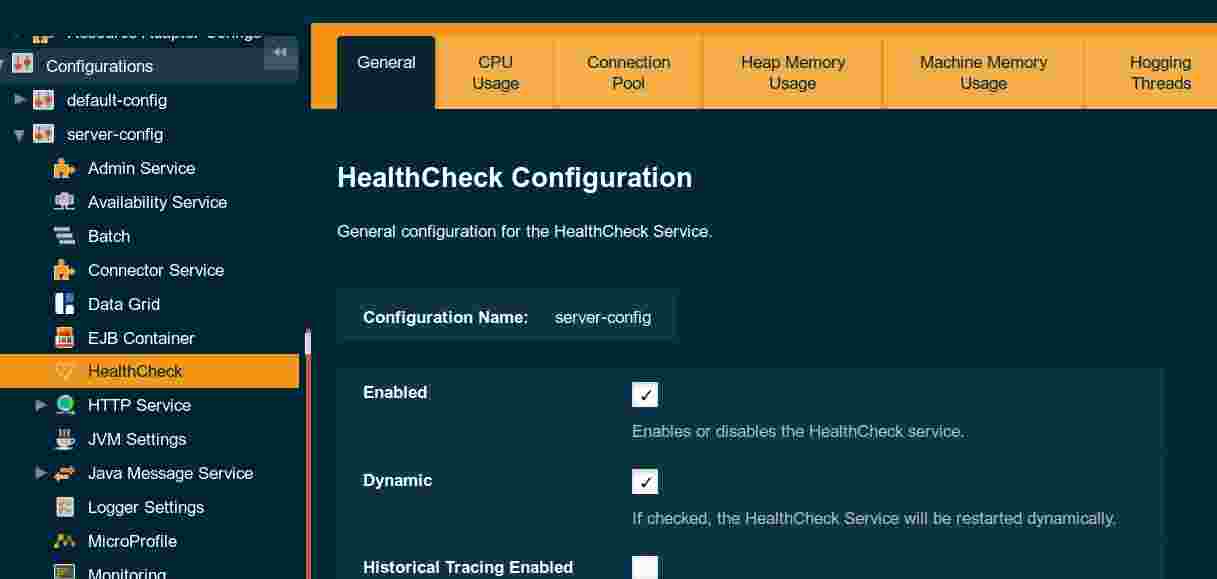
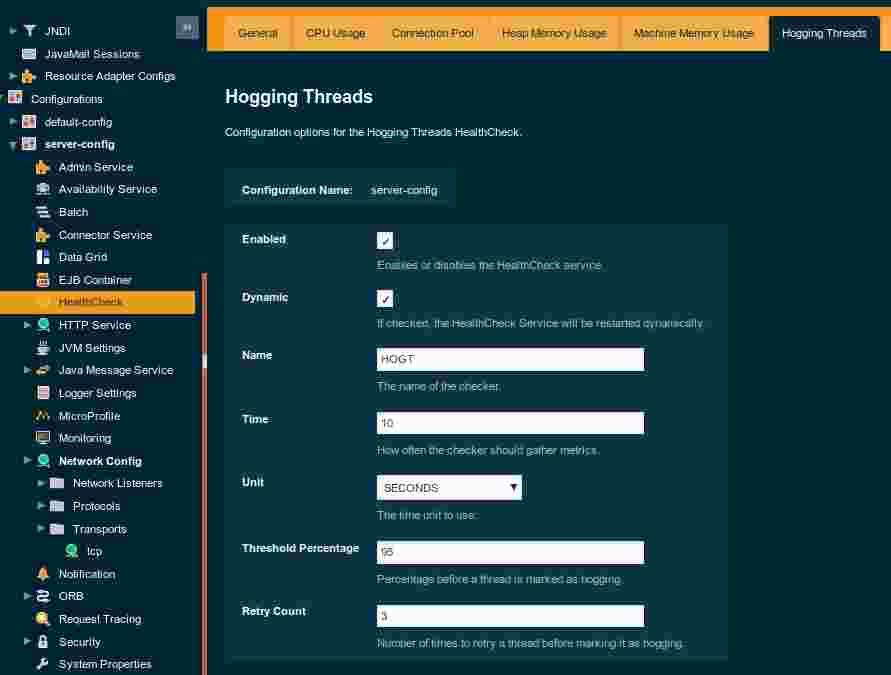
The Health Check Service is not enabled by default. It can be easily enabled in Payara Server’s Admin Console, in the HealthCheck configuration page:
You can also enable it using the asadmin set-healthcheck-configuration command:
asadmin> set-healthcheck-configuration --enabled=true --dynamic=true
The argument --dynamic=true is necessary to turn on the service for a running server, otherwise it would only be applied after a server restart.
We can check the actual configuration of the Health Check Service and all its metrics using asadmin get-healthcheck-configuration:
asadmin> get-healthcheck-configuration
This is an example output from the above command, after some Health Check services have been configured:
Health Check Service Configuration is enabled?: true
Historical Tracing Enabled?: false
Name         Notifier Enabled
SNMP         false
CDIEVENTBUS  false
EMAIL        false
SLACK        false
EVENTBUS     false
JMS          false
NEWRELIC     false
LOG          true
XMPP         false
HIPCHAT      false
DATADOG      false
Below are the list of configuration details of each checker listed by its name.
And this is an example of log messages produced by the above configuration:
Health Check notification with severity level: INFO - MEMM:Health Check Result:[[status=GOOD, message='Physical Memory Used: 18.40 Gb - Total Physical Memory: 31.30 Gb - Memory Used%: 58.80%'']']|#]
Health Check notification with severity level: INFO - MEMM:Health Check Result:[[status=GOOD, message='Physical Memory Used: 17.80 Gb - Total Physical Memory: 31.30 Gb - Memory Used%: 56.88%'']']|#]
Health Check notification with severity level: INFO - MEMM:Health Check Result:[[status=GOOD, message='Physical Memory Used: 17.91 Gb - Total Physical Memory: 31.30 Gb - Memory Used%: 57.21%'']']|#]
In order to configure the Health Check service to monitor a specific metric, a service for that individual metric must be configured first.
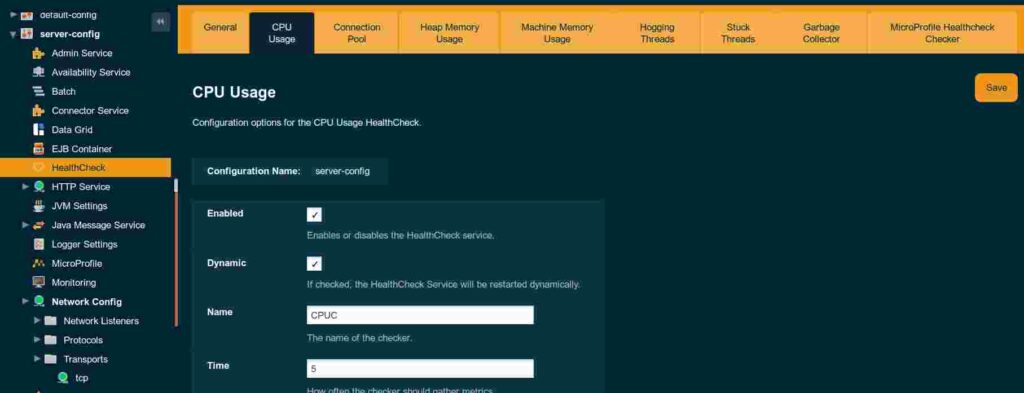
The HealthCheck page in the Admin Console contains a tab with configuration for each individual service, e.g. for CPU Usage:

Individual services can also be configured using the asadmin set-healthcheck-service-configuration command:
asadmin > set-healthcheck-service-configuration --service=<service.name> --enabled=true --dynamic=true --time=<time value> --time-unit=<time unit enum>
--threshold-critical=90 --threshold-warning=50 --thresholdGood=0
All of the services accept a configuration of the time interval, in which the Health Check for that service is evaluated. The --time argument specifies the number portion of the time. The --time-unit argument specifies the unit which is a string representation of any unit from the TimeUnit Java enum.
The name of each Health Check service is listed in the Payara reference documentation for the set-healthcheck-service-configuration command. Here are the names for the currently available services:
"stuck-thread" or “st"- detects all requests that block threads for too long"mp-health" or “mh" (MicroProfile Health) – detects MicroProfile health endpoint status"connection-pool" or “cp" – tracks how much is a connection pool utilized"cpu-usage" or “cu" – tracks how much is the CPU utilizedgarbage-collector" or “gc" – tracks the number of garbage collectionsheap-memory-usage" or “hmu" – tracks the amount of heap memory used"machine-memory-usage" or “mmu" – tracks the amount of RAM used"hogging-threads" or “ht" – detects threads that consume a lot of CPUYou can use both the long name and the short variant as the value of the –service argument.
For example, to configure the frequency of executing the health checks for the CPU usage to be every 5 minutes, we would run the following asadmin command:
asadmin > set-healthcheck-service-configuration --service=cpu-usage --time=5 --time-unit=MINUTES --enabled=true --dynamic=true
The same command can also be used to configure the thresholds:
set-healthcheck-service-configuration --service=cpu-usage --enabled=true --dynamic=true --threshold-critical=90 --threshold-warning=45 --threshold-good=20
Note that it’s possible to list all the Health Check services with the list-healthcheck-services command. However, this command prints service names that are not valid for set-healthcheck-service-configuration command. They are valid for older asadmin commands which are now deprecated. We plan to change the output to match the new service names in the future.
The Health Check service offers 3 services that check resource usage:
For all three of these metrics, the service will run periodically and it will compare the calculated values (% of use) to the threshold configuration values (GOOD, WARNING and CRITICAL) and issue alerts in the standard logging mechanism configured for the domain.
The following table summarizes the boundaries for each alert severity:
| Lower Boundary (Including equal) | Upper Boundary (Not equal) | Result |
| 0 | GOOD-Threshold | No event is logged |
| GOOD-Threshold | WARNING-Threshold | GOOD event logged |
| WARNING-Threshold | CRITICAL-Threshold | WARNING event logged |
| CRITICAL-Threshold | 100 | Critical Event Logged |
For example, if the CPU usage service calculates the value of 21.8%, with these thresholds in the configuration
then a GOOD notification will be triggered. If the Log notifier is enabled, an INFO message similar to this one would be written to the server’s log file:
[2019-10-03T11:03:19.460+0200] [Payara 5.193] [INFO] [] [fish.payara.nucleus.notification.log.LogNotifierService] [tid: _ThreadID=122 _ThreadName=payara-executor-service-scheduled-task] [timeMillis: 1570093399460] [levelValue: 800] [[
Health Check notification with severity level: INFO – CPUC:Health Check Result:[[status=GOOD, message=’CPU%: 21.08, Time CPU used: 201 milliseconds”]’]]]
Note that the INFO log level corresponds to the GOOD Health Check event.
The Health Check service provides services to detect suspicious behavior of threads used within Payara Server. These allow to detect the following types of misbehaving threads:
To configure how the threshold for hogging threads is evaluated, the Hogging Threads service offers the following 2 parameters:
hogging-threads-threshold: Defines the minimum percentage needed for the thread to count as being hogged CPU-wise. The percentage is calculated with the ratio of elapsed CPU time to the service execution interval. Its default value is 95.hogging-threads-retry-count: Represents the number of times the service should detect the same hogged thread in order to trigger health check notifications for that thread. Its default value is 3.These can be configured in the Hogging Threads tab in the Admin Console:
And again, the set-healthcheck-service-configuration command can be used to configure these parameters too:
asadmin set-healthcheck-service-configuration --service=hogging-threads --enabled=true --dynamic=true --hogging-threads-threshold=95 --hogging-threads-retry-count=3
The Stuck Threads service threshold is also configured by special parameters:
stuck-threads-threshold – the minimum time since a thread was claimed to process a request after which it’s considered stuckstuck-threads-threshold-unit – the time unit for the thresholdThese can be configured in the Stuck Threads tab in the Admin Console and also using the set-healthcheck-service-configuration command as well.
The garbage collection Health Check Service checks periodically for any garbage collections. It calculates and prints out how many times garbage collections were executed within the time elapsed since the last check. The log messages include the following information for both young and older generation garbage collection types:
For this service, it’s also possible to set the standard GOOD, WARNING and ERROR thresholds. The value for the threshold is calculated based on the amount of the GC activity.
The connection pool health check service checks how many connections in a JDBC connection pool are used and how many remain free. If the ratio of used connections hits the configured thresholds, it will print an appropriate alert message to the log. If there are multiple connection pools being used, the alert will include information about all of them.
Payara Platform allows applications define custom health checks using the MicroProfile Health API. The results of these checks are normally available via an HTTP endpoint. With the MP Health service in the Health Check service, it’s possible to detect an unhealthy status reported by this HTTP endpoint periodically and trigger notifications in the same way as with other Health Check services. Moreover, this service will monitor these Health HTTP endpoints of all the server instances in the Payara domain and trigger notifications if any of them reports unhealthy status.
Once you enable the MP Health service in the Health Check service, no further configuration is needed. The service will automatically scan all available MicroProfile Health endpoint in the configured interval and will trigger notifications for the following HTTP responses:
We intended to give you a thorough overview of what the Health Check Service provides and how all the monitoring metrics can be configured. For more information, you can always refer to the HealthCheck Service documentation page, which provides up-to-date information and will keep being updated when new metrics are added in future versions of Payara Server.
The Health Check service is also available in Payara Micro edition. You can configure it using asadmin commands in a post boot command file. Refer to the Payara Micro documentation about using the post boot command file.
Share:

 4 minutes
The March 2026 release brings important platform modernization, stability improvements, and comprehensive bug fixes across the Azul Payara Platform […]
 1 minute
Earlier this week, we’ve launched the 2026 Payara Platform Community Survey and we’d love to hear from you. If […]
 1 minute
The software development industry is more competitive than ever. Being a strong technical expert is essential, but on its […]
Thanks very much for this. But is there any way to link the logs to another service. Say link it to deploying another aws container when the memory utilization is on a certain percentage
Hi Idris,
This blog was written at the time when the Health Check service could only send alerts to the log file. Since then, the Health Check service sends alerts to the Notification service, which can print them to the log file as before but also send it to a range of other notifiers. The alerts can be sent directly to a list of supported external services such as New Relic or DataDog, or can be picked up by your custom application listening on a JMS queue or for CDI events. For more information, see the documentation: https://docs.payara.fish/documentation/payara-server/notification-service/notifiers.html
As an example, you can send the messages to a JMS queue as described in this blog post: https://www.payara.fish/blog/using-the-jms-notifier-with-payara-micro. Then you can create an application that listens to the JMS messages and decides what to do for received alerts, e.g. spawn a new AWS container if memory is low.
Is there a way to diagnose which thread was stuck?
Hi, Sam,
The information about the Stuck thread event should contain at least the thread name, the thread ID, its state, and a stack trace if any. The information for each stuck thread is constructed from the associated java.lang.management.ThreadInfo object by calling it’s toString() method.