Making Use of Payara Server’s Monitoring Service – Part 1: Setting up the Service
Product News
(note: there is an updated version of this blog post available here https://www.payara.fish/blog/making-use-of-payara-servers-jmx-monitoring-service-part-1-setting-up-the-service)
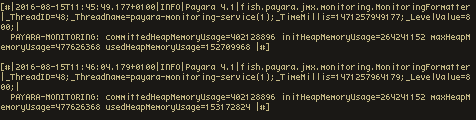
With the release of version 4.1.1.163, Payara Server includes a JMX Monitoring Service (technical preview) which can be used to log information from MBeans to the server log. Using the Monitoring Service, you can monitor information about the JVM runtime such as heap memory usage and threading, as well as more detailed information about the running Payara Server instance. The information is logged as a series of key-value pairs prefixed with the string PAYARA-MONITORING:, making it easy to filter the output using tools such as Logstash or fluentd.
In this blog series we’re going to show you exactly how to use the new Payara Server Monitoring Service. First, we’ll take a look at setting up the service – let’s get started!
The Monitoring Service is disabled by default, so it must be configured to get some metrics. A convenient way to configure the Monitoring Service is with the new asadmin command set-monitoring-configuration.
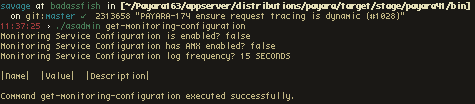
To view the current monitoring configuration there is the get-monitoring-configuration asadmin command. The service configuration is displayed first, followed by a table of MBean attributes that are being monitored.
Calling the get-monitoring-configuration command should show the following for the default configuration:
The Monitoring Service has four configuration options, each of which have their own default values:
| Option | Type | Role | Default |
|---|---|---|---|
enabled | Boolean | If true the service will run | false |
amx | Boolean | If true will boot the AMX interface automatically at startup | false |
logfrequency | Long | The rate at which monitoring data is logged | 15 |
logfrequencyunit | TimeUnit | The unit of the rate at which monitoring data is logged | SECONDS |
Alongside these options, the configuration accepts properties which represent the MBean attributes to monitor. Each property can have name, value and description. The name is the MBean Attribute, the value is the MBean ObjectName and the description is some extra information that is printed as part of the get-monitoring-configuration asadmin command. Both the name and value fields are required, but description is completely optional. An example property might have the following:
name="HeapMemoryUsage" value="java.lang:type=Memory" description="JVM_Heap_Usage"
To configure the Payara Server Monitoring Service using asadmin you’ll need a running instance available.
To add a property to monitor you can use the --addproperty option of set-monitoring-configuration. This option takes a string wrapped in single quote marks (‘ ‘), containing space delimited key-value pairs. An example of adding a property is:
asadmin> set-monitoring-configuration --addproperty 'name=HeapMemoryUsage value=java.lang:type=Memory description=JVM_Heap_Usage' --enabled false
After running the command the get-monitoring-configuration command will show something like this:

Here two options have been used: 1. --addproperty This option adds the property with the name, value and description given to it. These should be passed with the option as shown in the aforementioned command. name and value must be provided here for a valid monitoring property. 2. --enabled This option is used to enable or disable the service and is a required option. false was given to it to retain the current value.
Note: The HeapMemoryUsage MBean attribute is composite, with multiple values stored within it. This means that by only providing name=HeapMemoryUsage the Monitoring Service will log all values stored in the attribute. As HeapMemoryUsage has values of committed, init, max and used these would all be included in the log message. If you wished to log just the value for used then you could provide name=HeapMemoryUsage.used and just the used value would be added.
In general, if an attribute is composite, providing name={$MBEANATTRIBUTE}.{$VALUE} will cause the Monitoring Service to attempt to extract the value when logging. In the previous example $MBEANATTRIBUTE would be HeapMemoryUsage and the $VALUE is used.
If you no longer wish to monitor a property or gave an invalid one, there is a --delproperty option available. To remove a property from the Monitoring Service, the name attribute of the property to delete must be specified:
asadmin> set-monitoring-configuration --delproperty HeapMemoryUsage --enabled false
This will entirely remove the property from the Monitoring Service’s configuration so, if the property needs to be re-added in future, it must be re-added in full.
With a property added, we will now get more useful output from the service if we enable it. Before enabling the Monitoring Service you could check that the configuration is as desired by using get-monitoring-configuration.
The Monitoring Service configuration can be either be reloaded dynamically or on next startup with the set-monitoring-configuration asadmin command. For dynamic reloading, set-monitoring-configuration provides a --dynamic option. Setting it to true will cause the service to stop logging with the previous configuration and then start logging with the new configuration without needing a restart. For this to apply, there must have been an existing configuration on server startup for the service to be reloaded. If not given, the service will be set to enabled and the configuration will be used on next startup or until --dynamic is next used.
So, to reload the configuration dynamically on the currently running server instance:
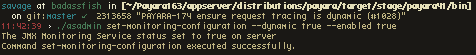
asadmin> set-monitoring-configuration --dynamic true --enabled true
The command result can be seen below:
If a non-empty monitoring configuration existed when Payara Server was started, the service should then start monitoring to the server.log file:


 4 minutes
The March 2026 release brings important platform modernization, stability improvements, and comprehensive bug fixes across the Azul Payara Platform […]
5 minutes
The February 2026 release of the Payara Platform is centered on a major initiative to streamline the platform. This involves removing […]
 5 minutes
Published a little later than usual due to a busy conference season, this edition looks back at the key […]

Hi Fraser, will you recommend enabling the monitoring service in production?
Hi Faiz,
You should be able to run the service in production without any problems already, but we wouldn’t recommend doing that without testing thoroughly in your own environment.
It’s unlikely to cause any issues, although there is always the chance of an edge case related to your environment. We would, of course, fully support the use of the service in production however so, with a support contract, you would be able to raise a ticket for any bug you may find.
Are you including or going to include any thread state information in these metrics?