New OpenTracing Features in Payara Platform 5.194
Uncategorized

Payara Platform has implemented MicroProfile OpenTracing with its own tracer that can be sent to other sources via the notification service. But maybe you don’t want to use Payara’s Tracer, and instead want to use a different one – now you can, starting from Payara Platform 5.194 onwards.
If you wish to use an alternative tracer, you must deploy it as a library to Payara with a file META-INF/services/io.opentracing.Tracer that lists the class name of the tracer to use.
As an example, if you wish to use the Jaeger Tracer you will need a wrapper for it – one is provided at https://github.com/payara/ecosystem-jaeger-tracing. Build the project with mvn clean install and then deploy the complete artifact with asadmin add-library jaeger-tracer-lib-jar-with-dependencies.jar. The JaegerTracerWrapper.java class shows how it is configured.
Configuration.SamplerConfiguration samplerConfig =Configuration.SamplerConfiguration.fromEnv().withType(ConstSampler.TYPE).withParam(1);
Configuration configuration =Configuration.fromEnv("jaeger-test").withSampler(samplerConfig);
This will create a tracer that will trace every request using the name “jaeger-test” when in the Jaeger tracer UI and will send it to a Jaeger collector on the same host (this is the Jaeger default).
Tracing must then be enabled in Payara Server, this can be done with the following asadmin commands:
set-requesttracing-configuration --enabled=true --dynamic=true

bootstrap-requesttracing
To view the results of the trace, a Jaeger collector must available. One can be started easily using docker as follows.
docker run --rm -p 6831:6831/udp -p 6832:6832/udp -p 16686:16686 jaegertracing/all-in-one --log-level=debug
The Jaeger UI is now available on port 16686 on the same host. Going to it will list the available traces, which are under the service name of “jaeger-test” in this example.
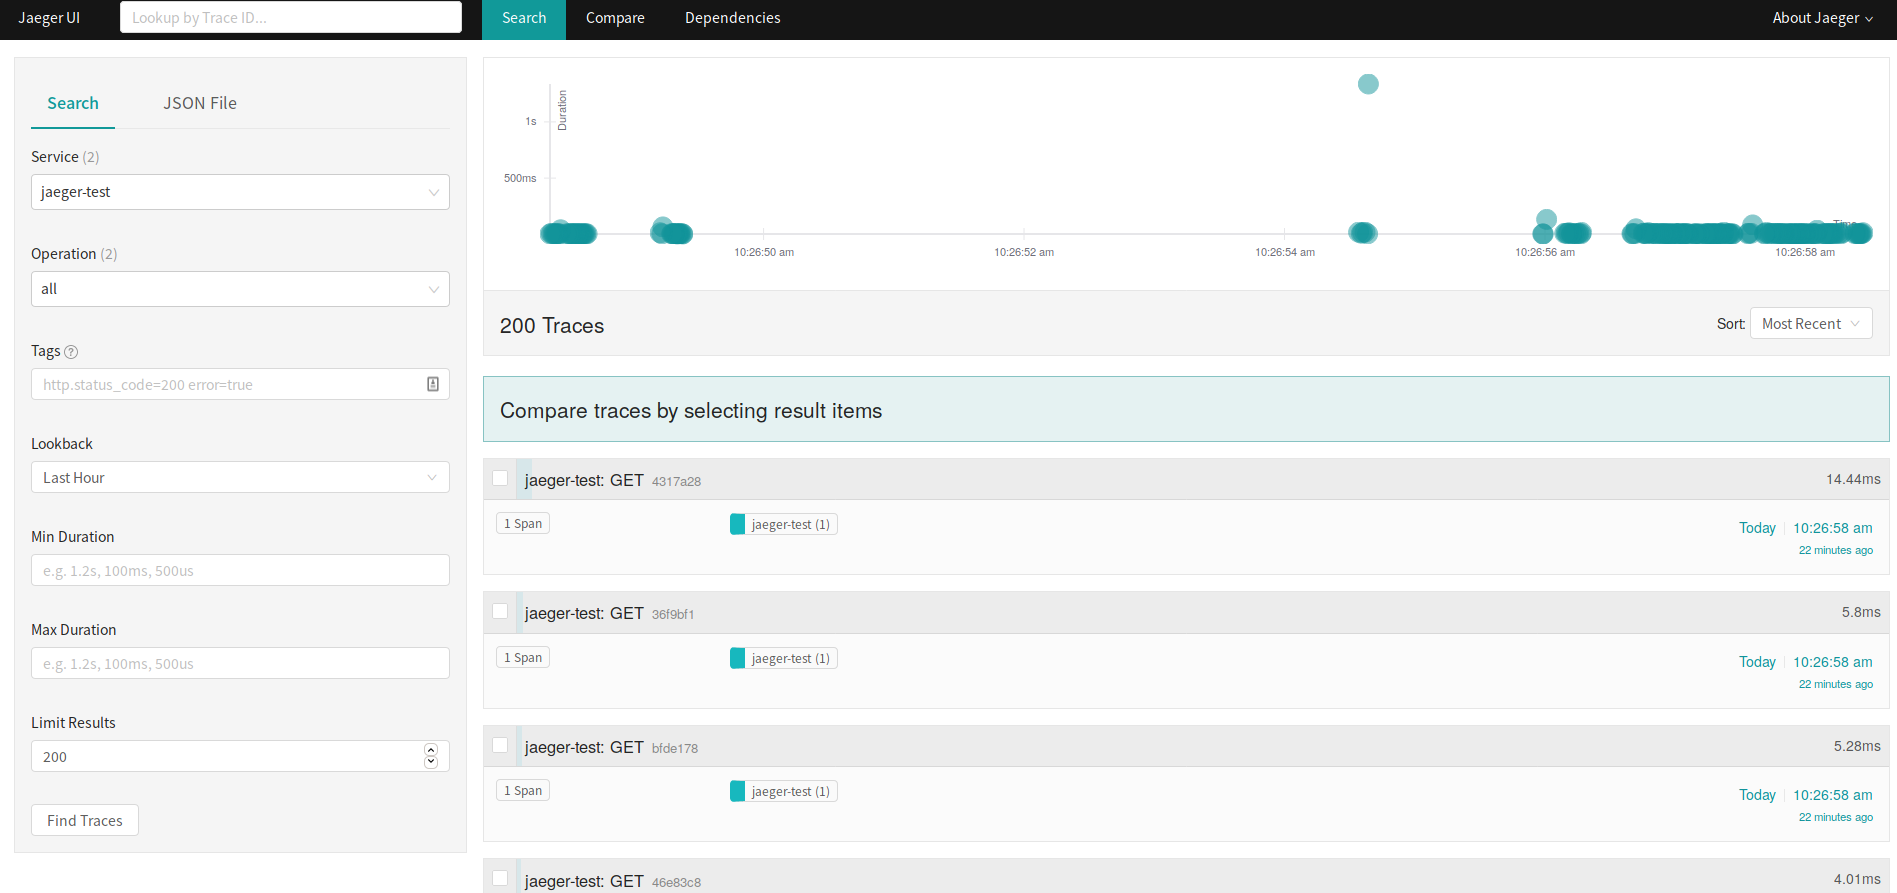
Here you can compare traces or get more details of an individual trace. So in this example, it is obvious that one request took a lot longer than anything else. Clicking on it to find out the details shows:
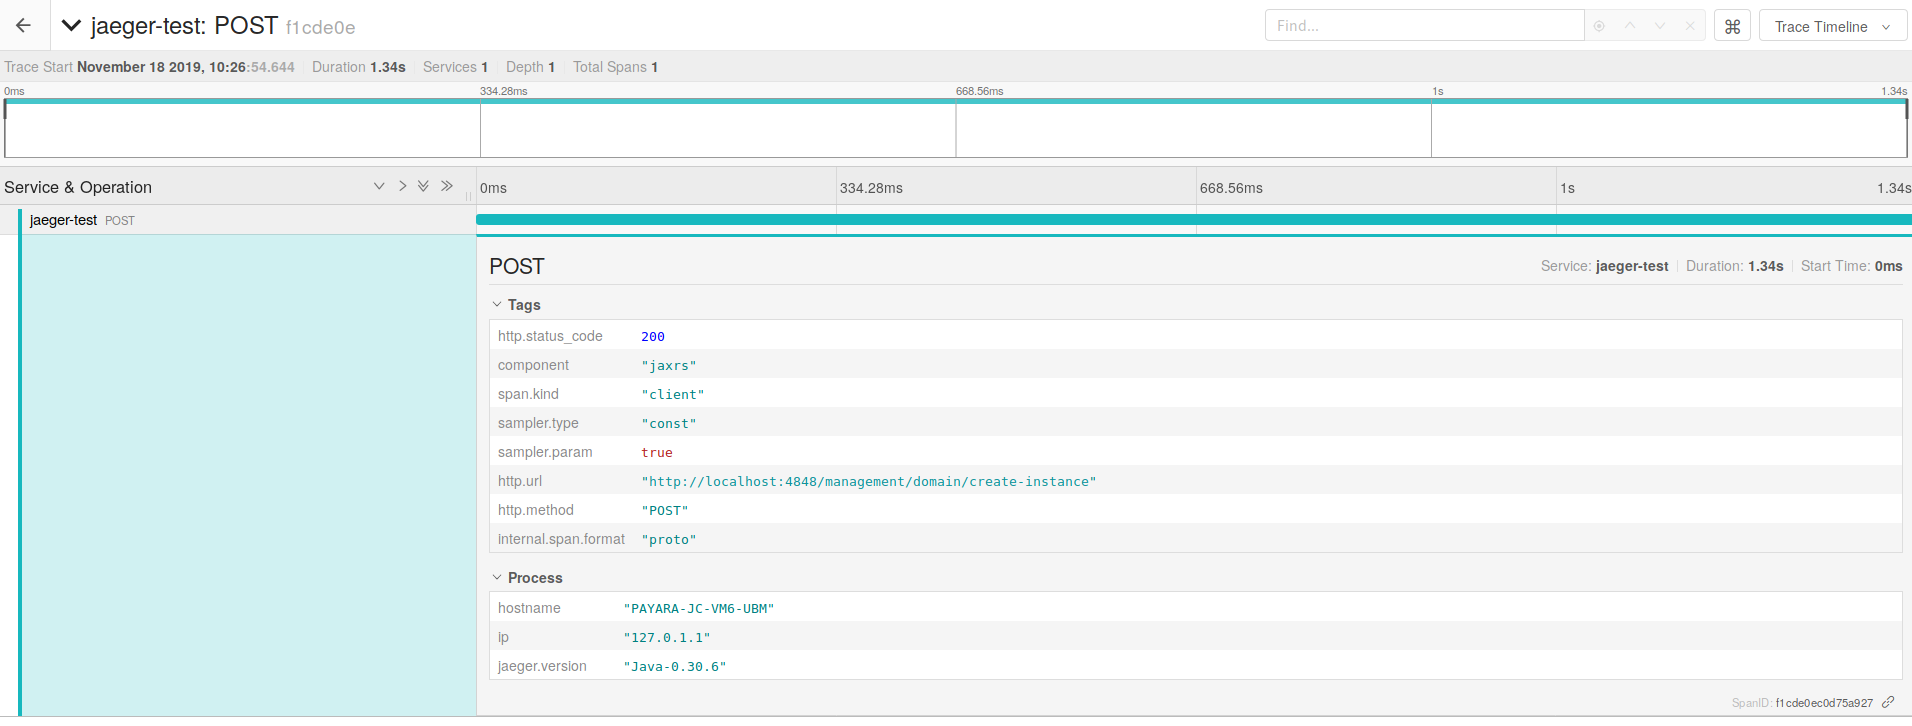
In this case, what took longer was creating a new instance. The other requests came from simple servlets.
Use the tracer of your choice starting with Payara Platform 5.194.
{{cta(‘b2e4c2b6-f33a-4ae4-9290-f1cf476f445a’)}}
Share:

 4 minutes
We’re excited to announce that Payara Platform Community 7 Beta application server is now fully certified as Jakarta EE 11 […]
 5 minutes
The September 2025 release marks a significant milestone with Payara 7.2025.1.Beta1 advancing Jakarta EE 11 readiness, alongside focused improvements […]
 4 minutes
Welcome aboard the August 2025 issue of The Payara Monthly Catch! With summer in full swing, things may have felt […]
Hi,
Great article and excellent examples. I managed to integrate jaeger with micro payara in docker, but I only have one question, so I didn’t get the logs sent by payara via stdout to the docker.
This is normal, is there a way to keep the logs along with the jaeger integration?
Hi Joel, I spoke with some of the team and if you are referring specifically to the OpenTracing logs – no. You either get the logs or Jaeger, you can’t currently have both unfortunately.