 4 minutes
What’s New in the Payara Platform March 2026 Release?
The March 2026 release brings important platform modernization, stability improvements, and comprehensive bug fixes across the Azul Payara Platform […]

 When we founded Payara and started development on Payara Server, one of our key goals was to make Payara Server the best application server for production work loads. Operations Teams will be happy to hear that the February 161 release adds Slow SQL Logging and in-built Server HealthChecks as new capabilities for managing production workloads!
{{cta(‘f53ec10a-12d5-483b-b089-2d4cdab10448’)}}
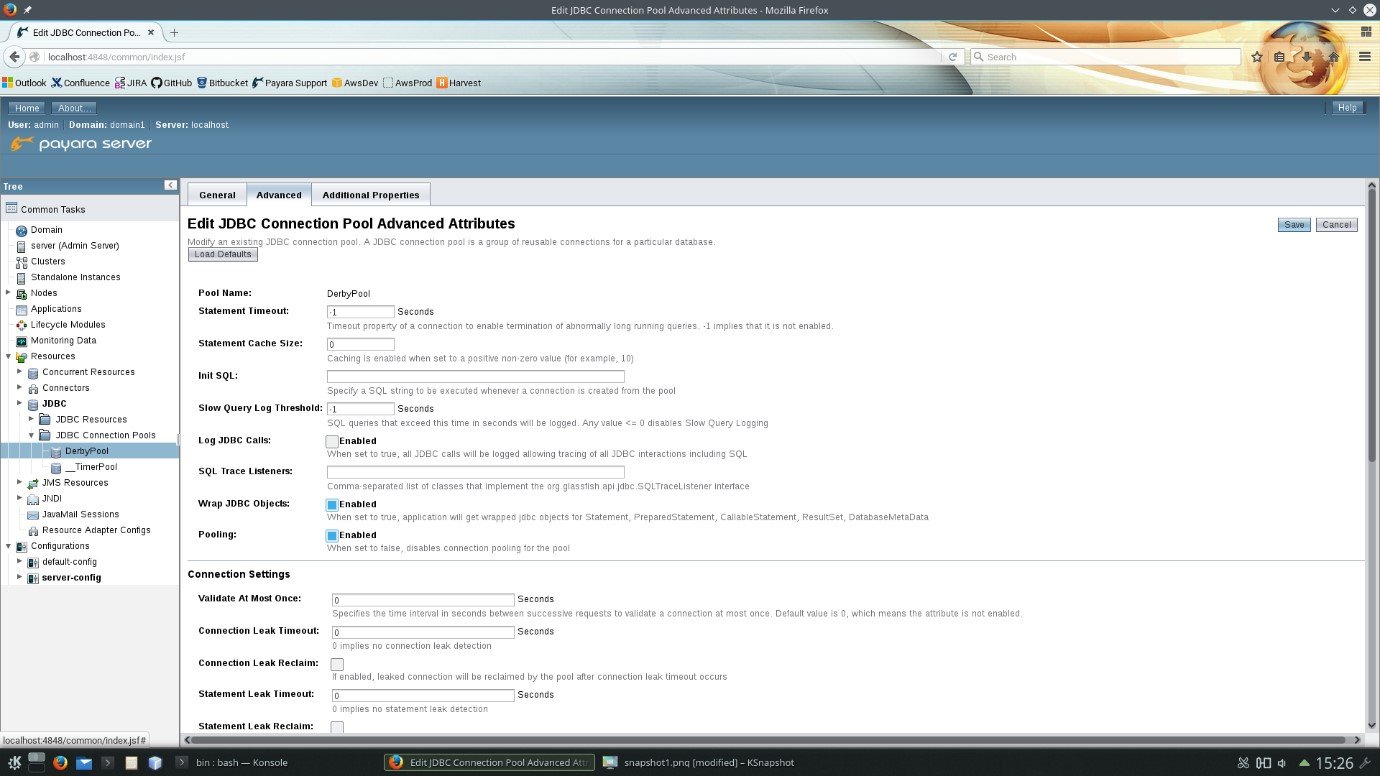
With the new Slow SQL Logging feature in Payara Server you can easily detect when a query to the database exceeds a specific time. This enables you to drill down to the actual line of code impacting production performance enabling rapid triage and fix of production performance issues in the database or inefficient SQL code in your Java EE applications.
Slow SQL logging is enabled for a specific datasource in the administration console in the advanced properties. The screen shot below shows you the DerbyPool settings.

(click to enlarge)
When a query exceeds the configured threshold a WARNING is output into the server log along with a full stack trace of the code that invoked the SQL. Allowing rapid identification of the offending code.
In the 161 release we also have the new HealthCheck Service. Payara Server now periodically checks;
If there is a problem with any of these metrics and they exceed a configurable threshold then a Warning, Error or Critical message is logged to the server’s log file. Again enabling operations teams to rapidly detect problems or work out what happened after problems have occurred.
With these two new features we want to make running Payara Server in production easier for Operations Teams. Both of these features are new in the upcoming Payara 4.1.1.161 release due on the 5th of February. Download Payara Server, try these new features and let us know what you think!
{{cta(‘f53ec10a-12d5-483b-b089-2d4cdab10448’)}} {{cta(‘9d4c1768-bbde-40f1-bf79-dd951a4b8699’)}}
Share:
 4 minutes
The March 2026 release brings important platform modernization, stability improvements, and comprehensive bug fixes across the Azul Payara Platform […]
 5 minutes
The February 2026 release of the Payara Platform is centered on a major initiative to streamline the platform. This involves removing […]
 5 minutes
Published a little later than usual due to a busy conference season, this edition looks back at the key […]
Slow SQL logging is a great idea to detect performance bottlenecks in production environments! Cool idead! 🙂