Introducing the Stuck Threads HealthCheck in Payara Server 173
Uncategorized
Since being introduced in the 163 release, the Request Tracing Service has allowed you to see which requests are taking a long time. However, this service will only tell you about requests once they have completed. If a thread is stuck and unable to complete you will not know about it. To resolve that problem, we added the Stuck Threads HealthCheck to Payara Server, which checks for requests that have not finished and outputs their stack trace.
The Stuck Threads HealthCheck is run on the same things the Request Tracing Service does:
Servlet HTTP requests
SOAP Web Service Requests
Requests started by a WebSocket message
Requests started by EJB timers
Requests started by a JMS message handled by a message-driven bean
Requests started by a JBatch job
Requests started when a new task is executed in a managed executor
JAX-RS endpoint REST requests
To use the Stuck Threads HealthCheck the HealthCheck Service must be enabled using either asadmin commands or through the admin console. The HealthCheck Service itself was covered in-depth in a previous blog.
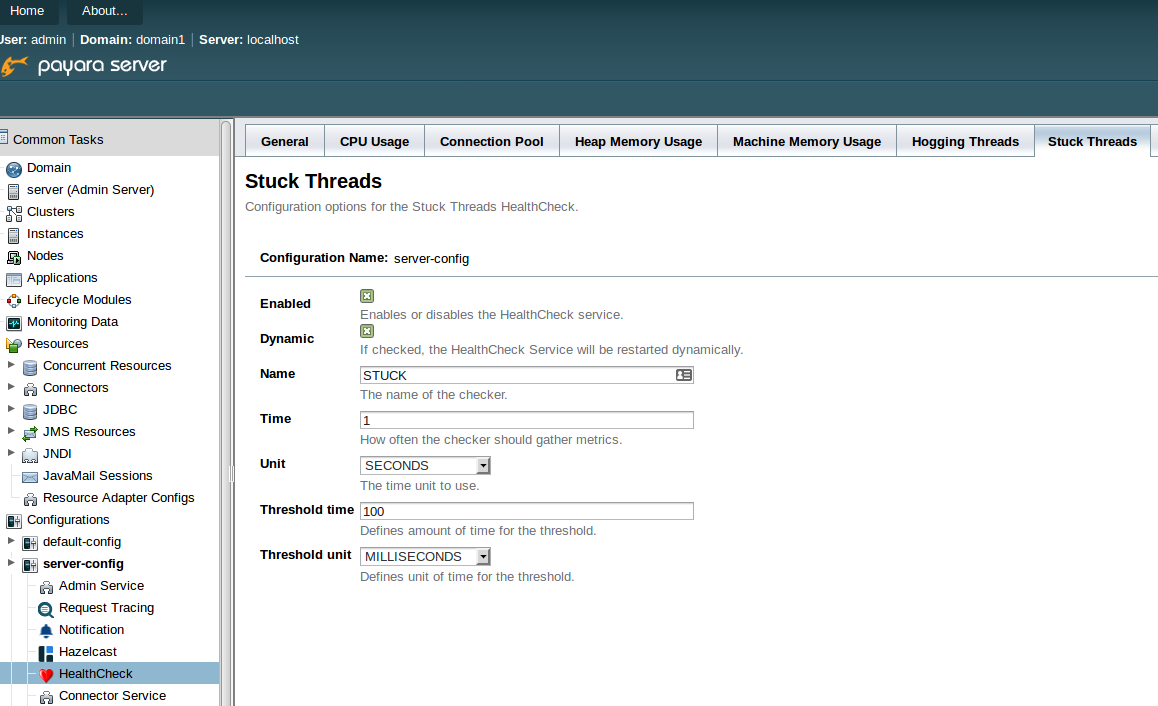
To enable the Stuck Threads HealthCheck itself in the admin console click on the Stuck Threads tab under the HealthCheck:
The time and unit fields specify how often the Stuck Threads HealthCheck should run. At this frequency, the HealthCheck will look at all running requests and will output those which have been running for longer than the threshold to the notification service.
Alternatively run the asadmin command:
healthcheck-stuckthreads-configure --enabled true --dynamic true --time 1 --unit SECONDS --threshold 100 --thresholdUnit MILLISECONDS
To see how it looks, take a look at the https://github.com/payara/Payara-Examples/tree/master/payara-services/request-tracing request-tracing example.
When it is run you will see something like the following in the log:
[2017-09-14T11:31:07.649+0100] [Payara 4.1] [INFO] [] [] [tid: _ThreadID=46 _ThreadName=http-thread-pool::http-listener-1(4)] [timeMillis: 1505385067649] [levelValue: 800] [[
 Entering EJB!]]

[2017-09-14T11:31:07.649+0100] [Payara 4.1] [INFO] [] [] [tid: _ThreadID=46 _ThreadName=http-thread-pool::http-listener-1(4)] [timeMillis: 1505385067649] [levelValue: 800] [[
 I'm being traced! Sleeping to exceed the threshold...]]

[2017-09-14T11:31:08.025+0100] [Payara 4.1] [WARNING] [] [fish.payara.nucleus.notification.log.LogNotifierService] [tid: _ThreadID=139 _ThreadName=healthcheck-service-4] [timeMillis: 1505385068025] [levelValue: 900] [[
 Health Check notification with severity level: WARNING - STUCK:Health Check Result:[[status=WARNING, message='Stuck Thread: "http-thread-pool::http-listener-1(4)" Id=46 TIMED_WAITING
 at java.lang.Thread.sleep(Native Method)
 at fish.payara.examples.requesttracing.traced.beans.RequestBean.traceMessage(RequestBean.java:31)
 at fish.payara.examples.requesttracing.traced.beans.RequestBean$Proxy$_$_WeldClientProxy.traceMessage(Unknown Source)
 at fish.payara.examples.requesttracing.traced.beans.EJB.traceMessage(EJB.java:26)
 at sun.reflect.NativeMethodAccessorImpl.invoke0(Native Method)
 at sun.reflect.NativeMethodAccessorImpl.invoke(NativeMethodAccessorImpl.java:62)
 at sun.reflect.DelegatingMethodAccessorImpl.invoke(DelegatingMethodAccessorImpl.java:43)
 at java.lang.reflect.Method.invoke(Method.java:498)
 ...

'']']]

[2017-09-14T11:31:12.650+0100] [Payara 4.1] [INFO] [] [] [tid: _ThreadID=46 _ThreadName=http-thread-pool::http-listener-1(4)] [timeMillis: 1505385072650] [levelValue: 800] [[
 Finished sleeping! Here, have a message: Oh! Hello! Isn't this cool?]]
In this case the request finished, although it did take a while. Just because a thread appears in the Stuck Thread Checker does not mean it’s not doing anything. In some cases, it taking a long time is the correct behaviour. It is possible that a thread could end up in a situation where it is completely stuck, i.e. where the thread ends up in an infinite loop or waits for some locked resources in a dead lock. If this happens then the only way to end the thread is to stop the server instance.
Share:

 4 minutes
The March 2026 release brings important platform modernization, stability improvements, and comprehensive bug fixes across the Azul Payara Platform […]
5 minutes
The February 2026 release of the Payara Platform is centered on a major initiative to streamline the platform. This involves removing […]
 5 minutes
Published a little later than usual due to a busy conference season, this edition looks back at the key […]
Hi Ondrej,
Great info! Thanks!
At the end you are writing the only way to end stuck threads is to stop the server instance. Ideally there would be an option to stop a stuck thread… For example if there is one running for more then x time, stop it…
Best regards
Frederik