Detect Slow SQL Queries With Payara Slow SQL Logger
Community
Slow SQL queries can silently undermine your application’s efficiency and the overall user experience. These sluggish queries not only frustrate users with long load times, but they can also have significant costs:
Payara Server offers the slow SQL logger feature that can help pinpoint the root cause of slow database interactions. The feature works by:
You can configure the slow SQL logger on Payara Server through the following options:
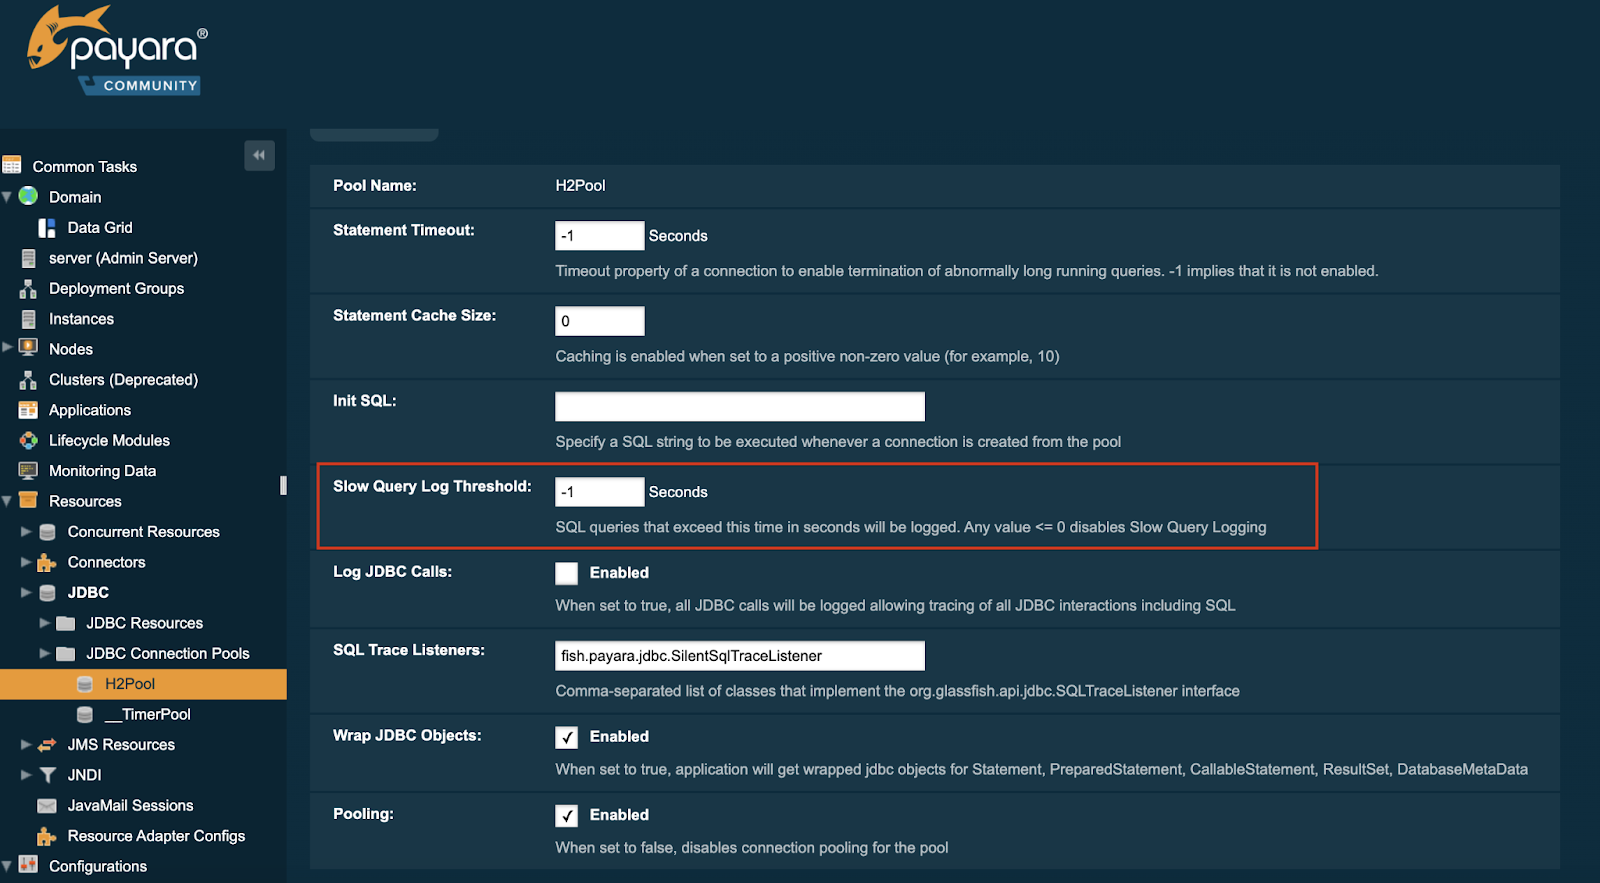
Asadmin Commands: Use the set command to modify the slow-query-threshold-in-seconds property of your connection pool
asadmin set domain.resources.jdbc-connection-pool.__TimerPool.slow-query-threshold-in-seconds=50
Application Deployment: If you use Jakarta EE, you can embed configuration directly within your application code using the @DataSourceDefinition annotation.
@DataSourceDefinition(

    name = "java:app/MyApp/MyDS",

    className = "org.h2.jdbcx.JdbcDataSource",

    url = "jdbc:h2:mem:test",

    properties = {"fish.payara.slow-query-threshold-in-seconds=5"})

Proactive Problem Solving
With the Payara Server slow SQL logger, you can analyze those slow queries and target the underlying causes:
Payara Micro also supports the slow SQL logger feature. This allows you to have in-depth insights into your cloud applications and potentially reduce cost by proactively identifying slow database queries that take up precious CPU cycle times. You can activate the slow SQL logger on Payara Micro through the @DataSourceDefinition as shown above. Otherwise, you can do so through the web.xml deployment descriptor.
By proactively detecting and analyzing slow SQL queries with Payara Server, you can safeguard your application’s performance, save on infrastructure costs, and create a smoother, more satisfying user experience. Download Payara Server Community or Payara Micro Community to get started.

Share:

 1 minute
Modern high-frequency trading (HFT) platforms operate under extreme performance constraints, processing tens of thousands of messages per second while […]
 1 minute
Earlier this week, we’ve launched the 2026 Payara Platform Community Survey and we’d love to hear from you. If […]
 5 minutes
February brought strong momentum across the enterprise Java ecosystem – from Agentic AI discussions and Jakarta EE evolution, to […]