Debugging: Diagnose and Detect the Cause of Errors in your Application
Payara

This debugging guide will help you to diagnose and detect the cause of errors in your application by debugging Payara Server or Payara Micro.
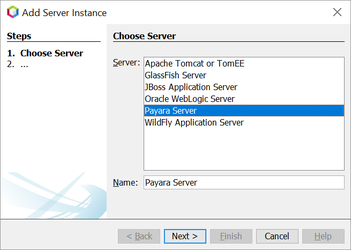
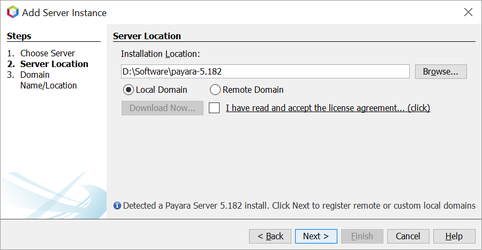
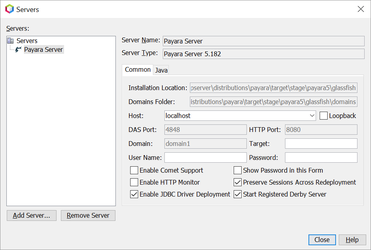
Prerequisites : Payara NetBeans IDE Plugins Installation
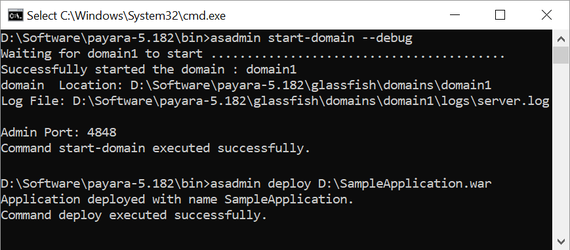
If you want to debug your application deployed on Payara Server, you may start a server in the debug mode :

If you want to debug your Payara Micro application, you may start a micro instance in the debug mode :
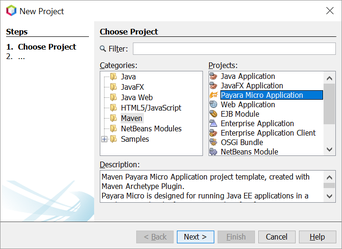
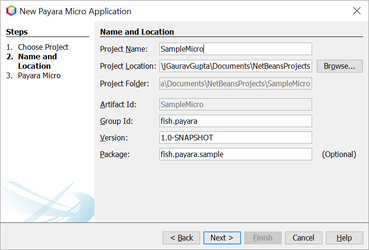
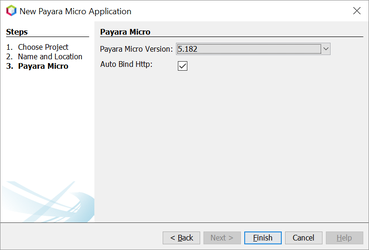
Payara Micro application can be created from command line using the following maven archetype command :
mvn archetype:generate -DarchetypeGroupId=fish.payara.maven.archetypes -DarchetypeArtifactId=payara-micro-maven-archetype -DarchetypeVersion=1.0.1 -DgroupId=fish.payara.micro -DartifactId=micro-sample -Dversion=1.0-SNAPSHOT
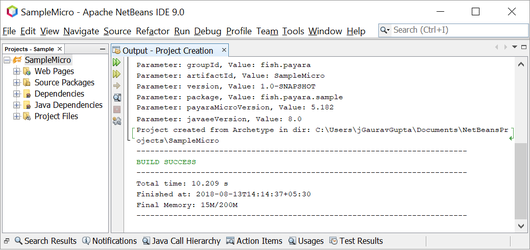
Maven will ask for the project detail confirmation. Press enter or press Y and Maven will start generate the Payara Micro project.
Now open the pom.xml and update the configuration of fish.payara.maven.plugins:payara-micro-maven-plugin by adding javaCommandLineOptions config under configuration tag :
<javaCommandLineOptions>
<option>
<value>-Xdebug</value>
</option>
<option>
<key>-Xrunjdwp:transport</key>
<value>dt_socket,server=y,suspend=y,address=5005</value>
</option>
</javaCommandLineOptions>
Now you are ready to start Payara Micro instance in debug mode with the following command :
mvn package payara-micro:start
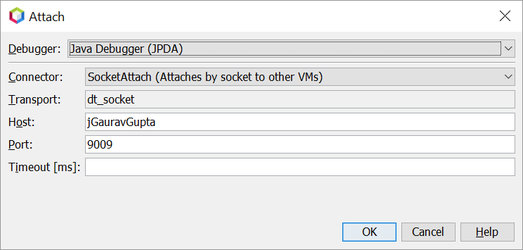
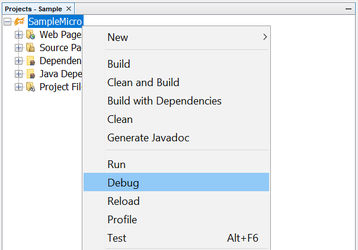
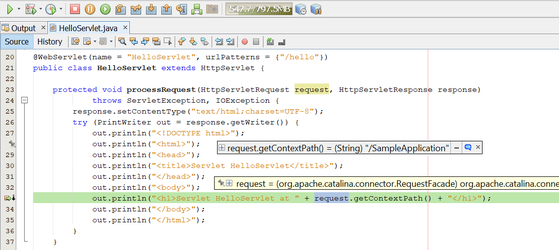
When payara-micro goals will start executing, you may manually attach the debugger to your application in the NetBeans IDE.
From the main menu, select Debug → Attach Debugger, enter the port value 9009 and click OK to connect :

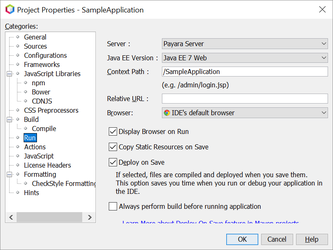
Now, load the project in the IDE and add the breakpoints in program to analyse the program execution.
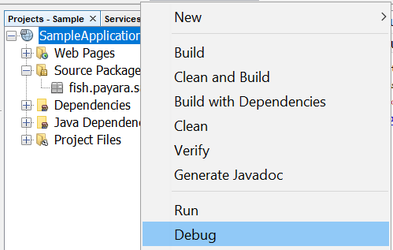
I recommend debugging via Payara Plugins
to quickly start the debugging session in one click.
{{cta(‘4c7626f5-1e53-418e-90c8-add6e4af19c9’)}}
Share:

 1 minute
Earlier this week, we’ve launched the 2026 Payara Platform Community Survey and we’d love to hear from you. If […]
 4 minutes
Strategic acquisition bolsters Azul’s Java platform with complementary products, deep Java expertise and accelerated go-to-market capabilities SUNNYVALE, Calif., and MALVERN, […]
 3 minutes
When legacy systems approach end-of-life (EOL), enterprise IT teams typically face the choice of moving forward at all costs […]
Hi Gaurav
Amazing post! Congrats!
Would I be able to debug payara micro using IntelliJ Community creating maven project (just like you did) using this debug setting in pom.xml?
Hi Fernando,
Yes, you will be able to debug the application from any Java IDE. You only need to attach the debugger manually from the IDE with the specified port in pom.xml.
I didn’t find this option in intellij. Would you know how to do it on intelliJ?
Hi Fernando,
You may manually attach debugger by creating the Remote run configuration in IntelliJ :
Goto Run menu > Edit Configuration > Click + > select Remote option > enter host & port details > Save configuration
Please follow the following StackOverflow answer for more details:
https://stackoverflow.com/questions/21114066/attach-intellij-idea-debugger-to-a-running-java-process?answertab=votes#
I just managed to debug at intelliJ community! Thank you!
Hi Gaurav
Can I use this post to ask how I could debug using IntelliJ Ultimate? I’ve seen some articles putting payara web profile as “add glassfish server” in intellij ultimate, but I don’t know how to do the same debug operation using payara micro?
Best Regards.
Payara Micro is based on the Java EE web profile, To start in debug mode you need to run java command with arg “-Xdebug -Xrunjdwp:transport=dt_socket,server=y,suspend=y,address=9009 -jar payara-micro-x.jar” or you may use Payara Micro Maven plugin and add these options in javaCommandLineOptions element and start instance using “mvn payara-micro:start”.
After running the Payara Micro instance, connect to debug port from IntelliJ IDEA as described in above comments.
Hello Gaurav
Thanks for the answer. I was able to debug the way you said, for testing purposes all right. But for real development, it would be best for an automatic way to add payara micro as if it were a glassfish server and let intellij ultimate debug it automatically. How would you do that? Isn’t there a payara micro version to be unzipped? Or use the webprofile version itself and add the payara microprofile implementation to pom?
Regards
Hi Fernando,
Glad to hear that you are able to debug Payara Micro in Intellij ultimate.
I would like to highly recommend to create tickets for a new feature in Intellij issue tracker (https://youtrack.jetbrains.com/issues).
Few tickets are already there for Payara Server integration: https://youtrack.jetbrains.com/issue/IDEA-212638