4 Production Features in Payara Server 5 You Might Not Know About
Payara
If you’ve upgraded to Payara Server 5 or are considering using Payara Server in production, here are 4 production features you might not know about – but should.
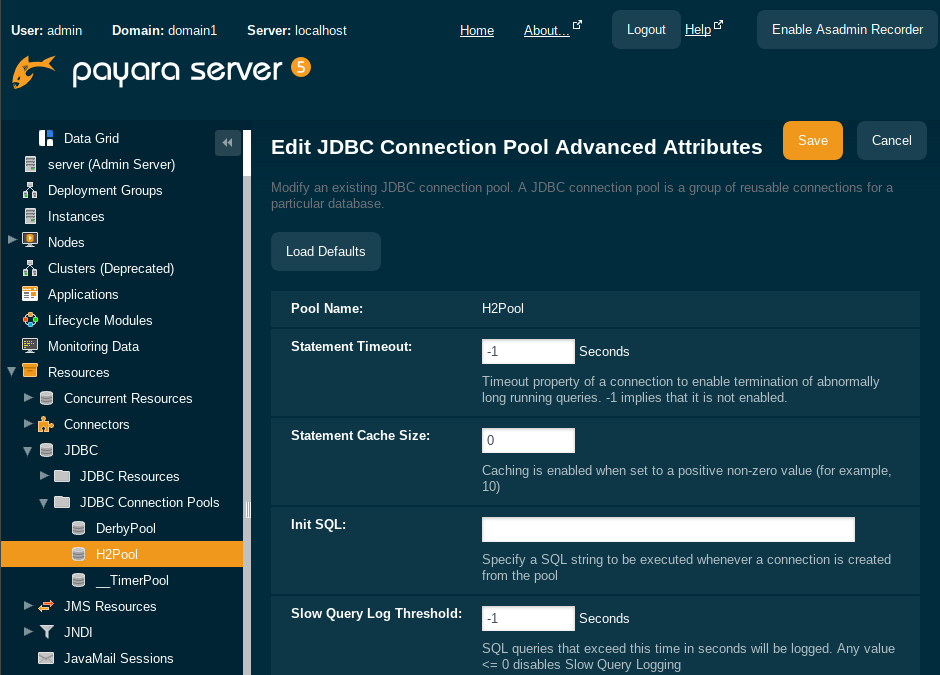
The Slow SQL logger monitors all queries executed on the connection pool and if they exceed a configurable execution time in seconds, a warning message is logged into the server log. The warning message (see below) logs the SQL query and the stack trace to the code executing the query. This enables rapid diagnosis, pinpointing the exact lines of code to investigate.
To configure slow SQL logging via the administration console, navigate to the connection pool’s Advanced Properties tab and specify the Slow Query Log Threshold time in seconds. A value of -1 disables logging of slow queries.

From within a system shell, we may run the asadmin monitor command to display real-time statistics. The –type parameter specifies which monitoring component should be monitored:
asadmin> monitor --type=jvm |
This command will log real-time data in intervals (every 30 seconds by default). We may redirect the output of the command to a file to archive monitoring information. There are 4 type of statistics we can monitor (arguments to –type parameter):
The command asadmin help monitor will provide detailed information about the monitor command.
Using asadmin, we can also access all the monitoring data by executing the following command:
asadmin> get --monitor server.* |
This command will return all available server and application monitoring data. This might easily be several hundred lines of text. Of course, we can use a more precise filter to limit the amount of data:
asadmin> get --monitor server.transaction-service.*
Or we may request data only about a specific module, for example:
asadmin> get --monitor server.transaction-service.committedcount-count
These commands provide exactly the same amount of information that is available through the REST interface. The last command corresponds to the following URL: http://localhost:4848/monitoring/domain/server/transaction-service/committedcount.
The Request Tracing Service provides tracing facilities for multiple protocols and process communications done by the components of deployed applications.
The service helps users to detect application slowness and performance degradation by logging requests that exceed a given threshold. The trace data from long-running requests gives insight to solving bottlenecks and other performance issues.
Because Request Tracing (and other monitoring) services depend on the Notification service to output their data, both the Notification service itself, and at least one notifier, must be enabled for any data to be recorded. If this does not happen, then the data will be discarded.
Below is a sample output from enabling the request tracing service in the admin console:
{
"traceSpans": [
{
"operationName": "processContainerRequest",
"spanContext": {
"spanId": "5148919a-2413-4cbd-af6c-8cb469f8b0ec",
"traceId": "e7ad7db6-b626-4995-aa10-e2e6a073033e"
},
"startTime": "2018-04-10T11:15:50.018+01:00[Europe/London]",
"endTime": "2018-04-10T11:15:50.164+01:00[Europe/London]",
"traceDuration": "146000000",
"spanTags": [
{ "Server": "server" },
{ "Domain": "domain1" }
]
},
{
"operationName": "authenticateJaspic",
"spanContext": {
"spanId": "374aefba-60ce-4011-98c5-9ade69eeeaeb",
"traceId": "e7ad7db6-b626-4995-aa10-e2e6a073033e"
},
"startTime": "2018-04-10T11:15:50.018+01:00[Europe/London]",
"endTime": "2018-04-10T11:15:50.019+01:00[Europe/London]",
"traceDuration": "1000000",
"spanTags": [
{ "Context": "" },
{ "AppContext": "__asadmin " },
{ "AuthResult": "true" },
{ "Principal": "admin" }
]
},
{
"operationName": "processServletRequest",
"spanContext": {
"spanId": "fd66fafe-a741-408c-b99a-cb7a963c07ac",
"traceId": "e7ad7db6-b626-4995-aa10-e2e6a073033e"
},
"startTime": "2018-04-10T11:15:50.019+01:00[Europe/London]",
"endTime": "2018-04-10T11:15:50.164+01:00[Europe/London]",
"traceDuration": "145000000",
"spanTags": [
{ "referer": "[https://localhost:4848/common/index.jsf]" },
{ "QueryString": "configName=server-config&bare=true" },
{ "host": "[localhost:4848]" },
{ "Class": "javax.faces.webapp.FacesServlet" },
{ "Method": "GET" },
{ "URL": "https://localhost:4848/payaraExtras/requestTracing/requestTracing.jsf" },
{ "accept-encoding": "[gzip, deflate, br]" },
{ "accept": "[*/*]" }
]
}
]
A SQL Trace Listener is registered against a data source and is called after each method call made on the JDBC connection pool.
SQL Trace Listeners allows developers to track all calls to the database and can be used to develop custom auditing, error handling or monitoring components. SQL Trace Listeners can be enabled globally on a data source if the class that implements it is on the server’s classpath, or can be enabled on application specific data sources by including them in the application’s WAR or EAR.
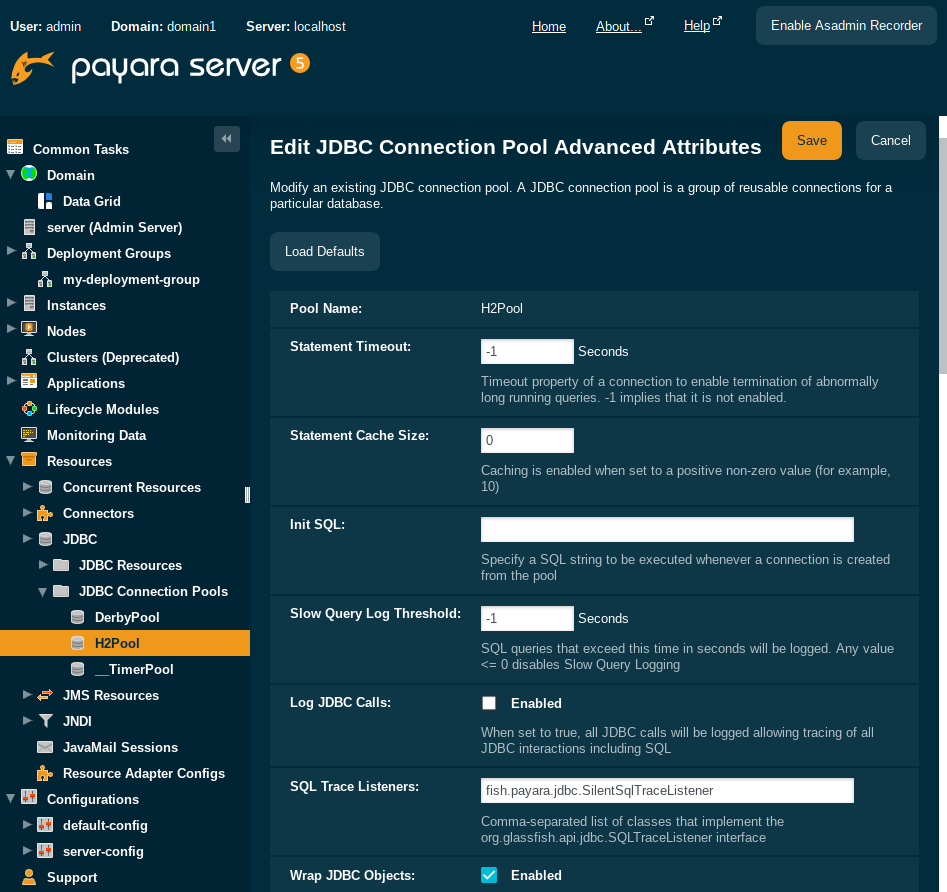
SQL Trace Listeners can be enabled on a JDBC connection pool through the administration web console. Navigate to the Advanced Tab of your connection pool by selecting the JDBC → JDBC Connection Pools → <Your Connection pool>.
Proceed to add the fully qualified class name of your SQL Trace Listener implementation class in the SQL Trace Listeners field:
Payara Micro also supports SQL Trace Listeners which brings powerful operational diagnostics to your microservices platform. Take a look at the instructions in the technical documentation to write a custom trace listener in the Payara Platform.
Want to learn more about using Payara Server in production? Take a look at our In Production Resources.
If you need help migrating to Payara Server or supporting your production Payara Server environment, consider our commercial support services.
If you’re not yet using Payara Server, download the open source software and try it out!
Share:

 1 minute
Earlier this week, we’ve launched the 2026 Payara Platform Community Survey and we’d love to hear from you. If […]
 4 minutes
Strategic acquisition bolsters Azul’s Java platform with complementary products, deep Java expertise and accelerated go-to-market capabilities SUNNYVALE, Calif., and MALVERN, […]
 3 minutes
When legacy systems approach end-of-life (EOL), enterprise IT teams typically face the choice of moving forward at all costs […]